Rで探索的因子分析をするには2つのパッケージの読み込みが必要である。
library( "psych" )
library( "GPArotation" )
シミュレーション・データ
psychパッケージにはHarman.Holzingerという認知能力テスト(IQテスト)のデータが含まれており、そのデータをシミュレーション・データとして利用する。
psychのDocumentationには下記のように記述されている。
Harman.Holzinger: 認知能力テストの9×9相関行列、N=696。 Harman.Holzinger。Harman (1967, p 244)の9つの心理変数は、K.J. Holzingerの696人の参加者による未発表の授業ノートから取られたものである。これは、4つの因子を持つ12のテストのサブセットである。これは、2因子解のもうひとつの素晴らしい例である。Bentler (2007)は、このデータセットを使って、信頼性分析について議論している。このデータは、明確な2因子構造を示し、オメガ関数に含まれる信頼性の様々な推定値の良い例となっている。BifactorのHolzingerやHolzinger.9のデータセットと混同しないようにしてほしい。
psych – Harman: Five data sets from Harman (1967). 9 cognitive variables from Holzinger and 8 emotional variables from Burt
https://www.rdocumentation.org/packages/psych/versions/2.2.5/topics/Harman
ただ、Harman (1976)を見る限り、このデータは4因子ではなく、3因子である。おそらく、psychパッケージのDocumentationは誤記であろう。
3因子の具体的な内容は下記のように示されている。
- Verbal: Word.meaning, Sentence.completion, Odd.words
- Arithmetic: Mixed.arithmetic, Remainders, Missing.numbers
- Spatial: Gloves, Boots, Hatchets
Holzingerによって提案された知的能力のテスト、つまりIQテストである。
このデータの初出はHolzinger & Swineford(1939)であるが、Harman(1976)でも引用されており、ここから引用されていることからHarman.Holzingerというデータセット名になったようである。
相関行列
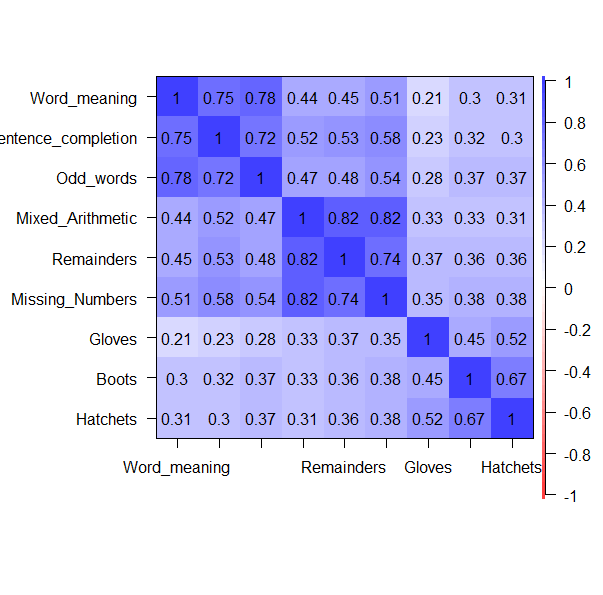
cor.plot()を使うことでヒートマップを描くことができる。
data(Harman)
cor.plot(Harman.Holzinger)

相関行列から、3因子であることはだいたい想定できる。
探索的因子分析
探索的因子分析はfa()で行う。
res_Holzinger_n3 <- fa(Harman.Holzinger, nfactors = 3, fm="minres",
                       rotate="oblimin", use="complete.obs")
print(res_Holzinger_n3, digits=3, sort=T)
- nfactors: 因子数
- fm: 推定法(デフォルトは"minres")
- rotate: 回転の種類("oblimin")
- digits: 結果表示の小数点以下の桁数
- sort: 因子の解釈をしやすいように並び替える場合は
sort=T、しない場合はsort=F
結果は以下のように出力される。
Loading required namespace: GPArotation

Factor Analysis using method =  minres
Call: fa(r = Harman.Holzinger, nfactors = 3, rotate = "oblimin", fm = "minres",
    use = "complete.obs")
Standardized loadings (pattern matrix) based upon correlation matrix
                    item    MR1    MR3    MR2    h2     u2  com
Mixed_Arithmetic       4  1.006 -0.047 -0.044 0.924 0.0757 1.01
Remainders             5  0.809  0.034  0.068 0.743 0.2571 1.02
Missing_Numbers        6  0.749  0.139  0.063 0.756 0.2444 1.08
Word_meaning           1 -0.053  0.948 -0.028 0.822 0.1779 1.01
Odd_words              3  0.005  0.823  0.085 0.750 0.2497 1.02
Sentence_completion    2  0.149  0.762 -0.032 0.712 0.2882 1.08
Hatchets               9 -0.039  0.002  0.902 0.785 0.2149 1.00
Boots                  8  0.030  0.040  0.726 0.575 0.4253 1.01
Gloves                 7  0.176 -0.073  0.547 0.371 0.6289 1.24

                        MR1   MR3   MR2
SS loadings           2.429 2.278 1.730
Proportion Var        0.270 0.253 0.192
Cumulative Var        0.270 0.523 0.715
Proportion Explained  0.377 0.354 0.269
Cumulative Proportion 0.377 0.731 1.000

 With factor correlations of
      MR1   MR3   MR2
MR1 1.000 0.586 0.443
MR3 0.586 1.000 0.428
MR2 0.443 0.428 1.000

Mean item complexity =  1.1
Test of the hypothesis that 3 factors are sufficient.

The degrees of freedom for the null model are  36  and the objective function was  5.907
The degrees of freedom for the model are 12  and the objective function was  0.017

The root mean square of the residuals (RMSR) is  0.006
The df corrected root mean square of the residuals is  0.01

Fit based upon off diagonal values = 1
Measures of factor score adequacy
                                                    MR1   MR3   MR2
Correlation of (regression) scores with factors   0.974 0.955 0.925
Multiple R square of scores with factors          0.950 0.913 0.855
Minimum correlation of possible factor scores     0.899 0.826 0.711
結果の解釈–因子
                    item    MR1    MR3    MR2    h2     u2  com
Mixed_Arithmetic       4  1.006 -0.047 -0.044 0.924 0.0757 1.01
Remainders             5  0.809  0.034  0.068 0.743 0.2571 1.02
Missing_Numbers        6  0.749  0.139  0.063 0.756 0.2444 1.08
Word_meaning           1 -0.053  0.948 -0.028 0.822 0.1779 1.01
Odd_words              3  0.005  0.823  0.085 0.750 0.2497 1.02
Sentence_completion    2  0.149  0.762 -0.032 0.712 0.2882 1.08
Hatchets               9 -0.039  0.002  0.902 0.785 0.2149 1.00
Boots                  8  0.030  0.040  0.726 0.575 0.4253 1.01
Gloves                 7  0.176 -0.073  0.547 0.371 0.6289 1.24
MR1は、Mixed_Arithmetic、Remainders、Missing_Numbersの3つの観測変数の値が高く、他の因子の値は高くないことから、MR1この3つの変数からなる因子であることがわかる。観測変数の性質から"Arithmetic"と名づけるのが適当であろう。
同じようにMR2の値が高いのは、Hatchets、Boots、Glovesの3つの観測変数の値が高い。この因子は"Spatial"という名称が適当であろう。
因子のネーミングは分析者にゆだねられており、含まれる観測変数から妥当な因子名を考える作業が因子分析の中でも重要な作業となる。
- h2: 共通性: 共通因子の影響の程度。
Verbal、Arithmetic、Spatialの3つすべての共通因子で説明される割合。 - u2: 独自性: 独自因子の影響の程度。第1因子の場合、3つの観測変数
Mixed_Arithmetic、Remainders、Missing_Numbersの因子で説明される割合。
共通性と独自性は加算すると"1"になる。
- com: 複雑性(ホフマンの指数):
はi番目の因子への因子負荷とした場合、下記の計算式であ。1に近い方が単純構造となる。
他の出力の解釈
                        MR1   MR3   MR2
SS loadings           2.429 2.278 1.730
Proportion Var        0.270 0.253 0.192
Cumulative Var        0.270 0.523 0.715
Proportion Explained  0.377 0.354 0.269
Cumulative Proportion 0.377 0.731 1.000
SS loadings: 因子寄与 Proportion Var: 因子寄与率 Cumulative Var: 累積因子寄与率 Proportion Explained: 説明率 Cumulative Proportion: 累積説明率
因子寄与率
因子寄与は各因子ごとに因子負荷量の二乗和したもの。
因子寄与率
因子寄与を観測変数の数で除したもの。
共通性の最大値は1 (独自性が0) であり、因子数がひとつであればその因子負荷量はlになる。
説明率
因子寄与を因子寄与の合計で除したもの。
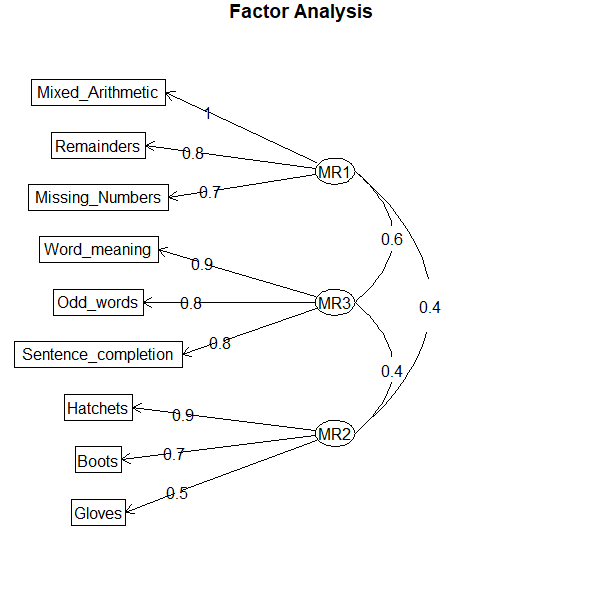
パス図の描画
fa.diagram(res_Holzinger_n3)

参考文献
- Holzinger, K. J., & Swineford, F. (1939). A study in factor analysis: The stability of a bi-factor solution. Chicago University Press.
- Harman, H. H. (1976). Modern factor analysis. 3rd ed. Illinois; The University of Chicago.
